Dimensionality Reduction#
Normalization#
#@title Load quality controlled data

adata_QC = sc.read_h5ad(filename= "/content/drive/MyDrive/scRNA_using_Python/Objects/sc_qc_filtered_covid.h5ad")

adata_QC
AnnData object with n_obs × n_vars = 3536 × 7650
    obs: 'type', 'sample', 'batch', 'n_genes_by_counts', 'total_counts', 'pct_counts_in_top_20_genes', 'total_counts_mt', 'pct_counts_mt', 'total_counts_ribo', 'pct_counts_ribo', 'total_counts_hb', 'pct_counts_hb', 'outlier', 'mt_outlier', 'n_counts', 'S_score', 'G2M_score', 'phase', '_scvi_batch', '_scvi_labels', 'prediction', 'leiden', 'doublet'
    var: 'gene_ids', 'feature_types', 'genome', 'mt', 'ribo', 'hb', 'n_cells_by_counts', 'mean_counts', 'pct_dropout_by_counts', 'total_counts', 'n_cells', 'mean', 'std'
    uns: '_scvi_manager_uuid', '_scvi_uuid', 'ambient_profile_Gene Expression', 'ambient_profile_all', 'leiden', 'leiden_colors', 'log1p', 'neighbors', 'pca', 'prediction_colors', 'sample_colors', 'type_colors', 'umap'
    obsm: 'X_pca', 'X_umap'
    varm: 'PCs'
    layers: 'ambient_counts', 'counts'
    obsp: 'connectivities', 'distances'
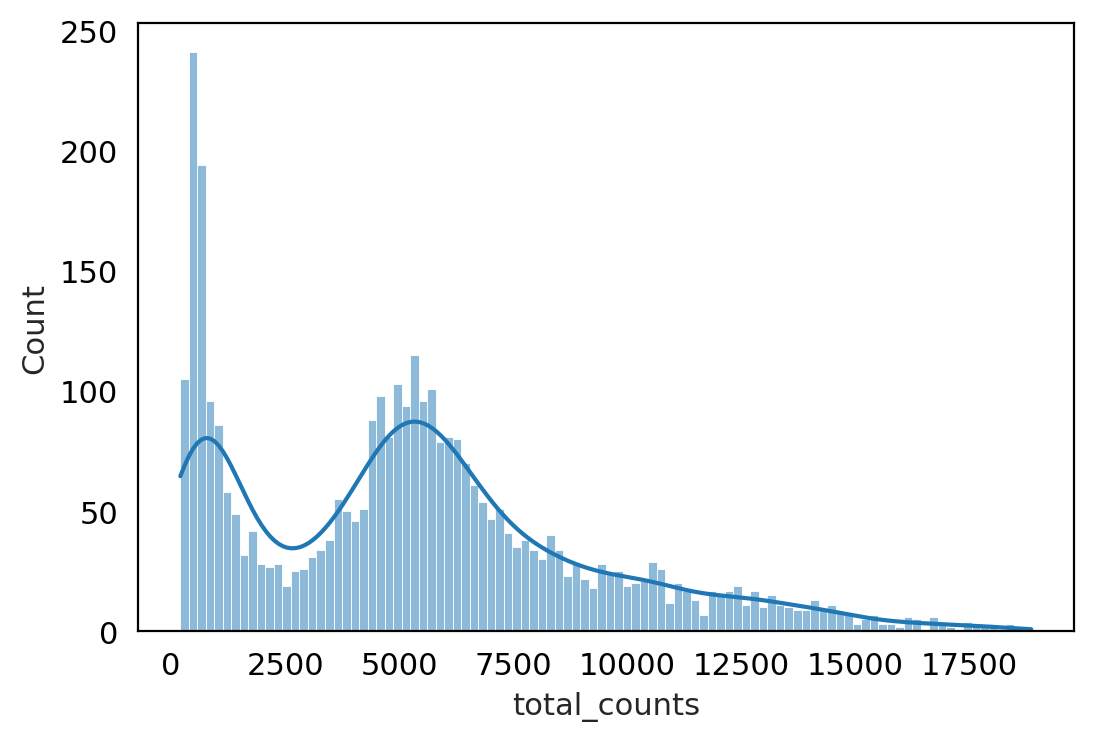
#@title check count distribution :

p1 = sns.histplot(adata_QC.obs["total_counts"], bins=100, kde= True)
Note :
At this stage we have cleaned data according to filtered cells , corrected ambient RNA and doublet removed .
But data we had count Matrix (cells X Genes) , still variance due to sampling effect (cell capturing, library preparation, sequencing ) .
The difference we get between cells gene expression may be because of these sampling effects not by real difference . so we need to Normalize to correct for variance.
Normalize by 2 methods :
Log shifted Normalization
doesn’t prevent heterogenity
corrects for library depth
Pearson residual Normalization (prevents heterogenity)
prevent heterogenity
corrects for library depth
#@title Method-1 : Log shifted method :


scales_counts = sc.pp.normalize_total(adata_QC, target_sum=None, inplace=False)
# log1p transform
adata_QC.layers["log1p_norm"] = sc.pp.log1p(scales_counts["X"], copy=True)

adata_QC
AnnData object with n_obs × n_vars = 3536 × 7650
    obs: 'type', 'sample', 'batch', 'n_genes_by_counts', 'total_counts', 'pct_counts_in_top_20_genes', 'total_counts_mt', 'pct_counts_mt', 'total_counts_ribo', 'pct_counts_ribo', 'total_counts_hb', 'pct_counts_hb', 'outlier', 'mt_outlier', 'n_counts', 'S_score', 'G2M_score', 'phase', '_scvi_batch', '_scvi_labels', 'prediction', 'leiden', 'doublet'
    var: 'gene_ids', 'feature_types', 'genome', 'mt', 'ribo', 'hb', 'n_cells_by_counts', 'mean_counts', 'pct_dropout_by_counts', 'total_counts', 'n_cells', 'mean', 'std'
    uns: '_scvi_manager_uuid', '_scvi_uuid', 'ambient_profile_Gene Expression', 'ambient_profile_all', 'leiden', 'leiden_colors', 'log1p', 'neighbors', 'pca', 'prediction_colors', 'sample_colors', 'type_colors', 'umap'
    obsm: 'X_pca', 'X_umap'
    varm: 'PCs'
    layers: 'ambient_counts', 'counts', 'log1p_norm'
    obsp: 'connectivities', 'distances'
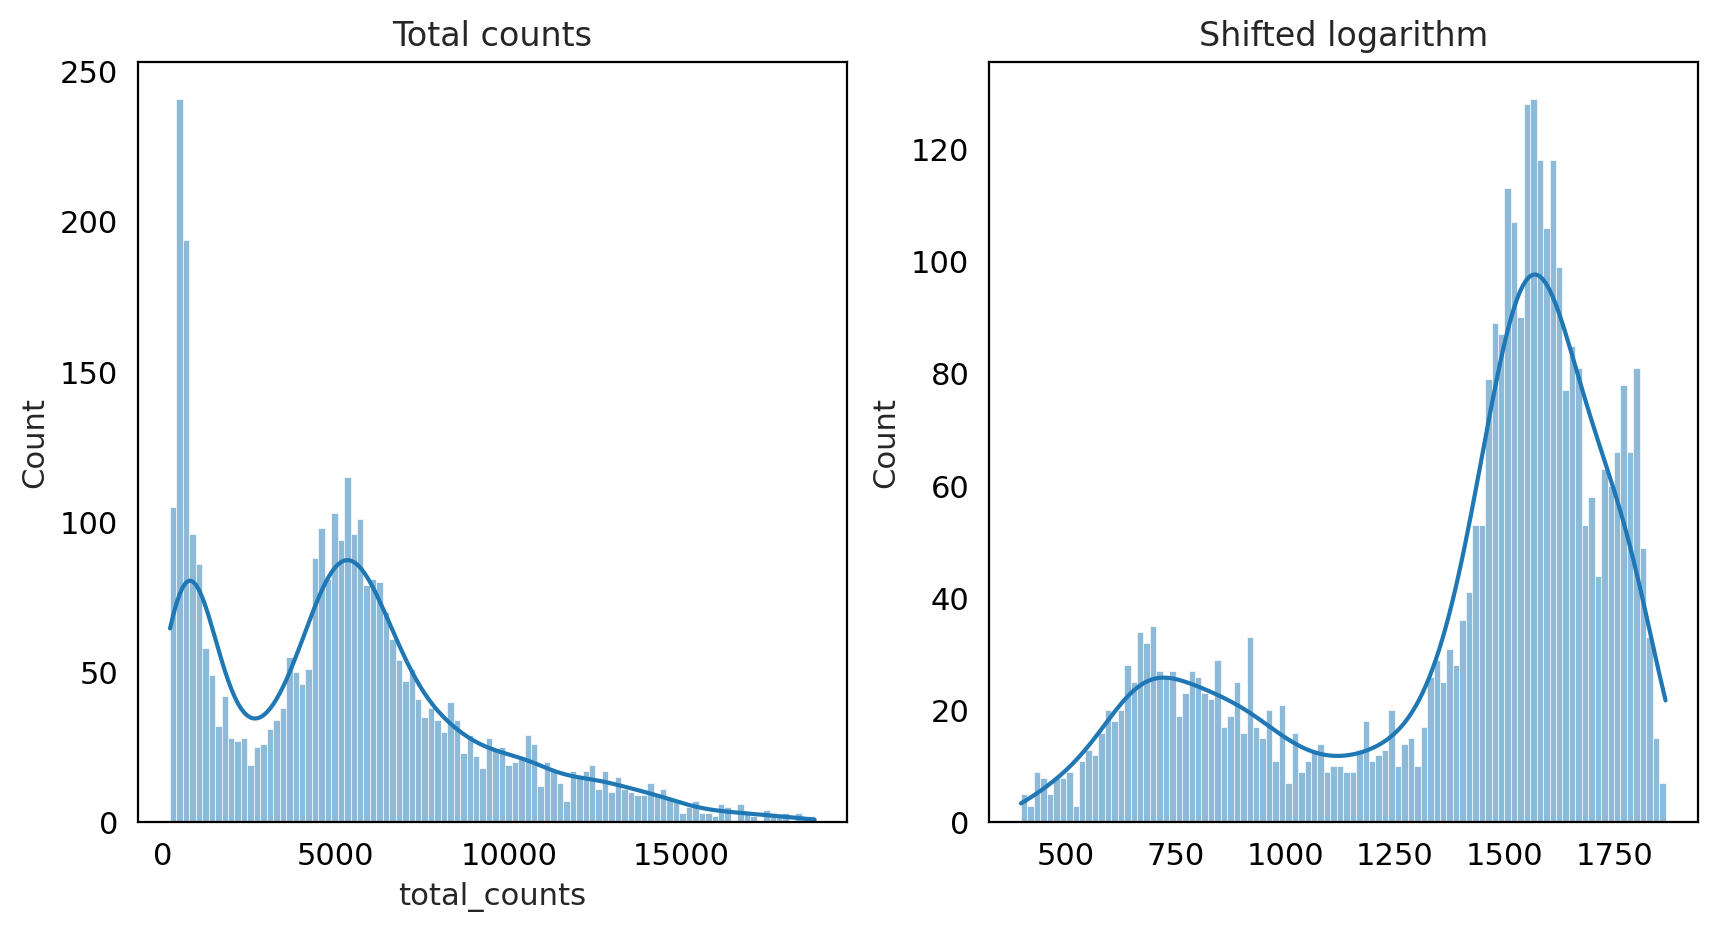
fig, axes = plt.subplots(1, 2, figsize=(10, 5))
p1 = sns.histplot(adata_QC.obs["total_counts"], bins=100, kde=True, ax=axes[0])
axes[0].set_title("Total counts")
p2 = sns.histplot(adata_QC.layers["log1p_norm"].sum(1), bins=100, kde=True, ax=axes[1])
axes[1].set_title("Shifted logarithm")
plt.show()
#@title Method-2 : Analytic Pearson residual method ( APR )
Pearson Residual :
In pearson residual method the preprocessed counts are compared to the expected counts of a “null model” ( This Null model includes technical variance cells but no biological variability between cells.)
Pearson residuals :
genes that are not differentially expressed = will have variance close to 1.
gene is differentially expressed, it will deviate from the null model, residual variance >1 for that gene
> Pearson Residual method helps in :
Remove the technical variation that comes from library depth
stabilize the mean-variance relationship across genes, i.e. ensure that biological signal from both low and high expression genes can contribute similarly to downstream processing
genes that are homogenously expressed (like housekeeping genes) have small variance, while genes that are differentially expressed (like marker genes) have high variance
analytic_pearson = sc.experimental.pp.normalize_pearson_residuals(adata_QC, inplace=False)
adata_QC.layers["APR_counts"] = csr_matrix(analytic_pearson["X"])

adata_QC
AnnData object with n_obs × n_vars = 3536 × 7650
    obs: 'type', 'sample', 'batch', 'n_genes_by_counts', 'total_counts', 'pct_counts_in_top_20_genes', 'total_counts_mt', 'pct_counts_mt', 'total_counts_ribo', 'pct_counts_ribo', 'total_counts_hb', 'pct_counts_hb', 'outlier', 'mt_outlier', 'n_counts', 'S_score', 'G2M_score', 'phase', '_scvi_batch', '_scvi_labels', 'prediction', 'leiden', 'doublet'
    var: 'gene_ids', 'feature_types', 'genome', 'mt', 'ribo', 'hb', 'n_cells_by_counts', 'mean_counts', 'pct_dropout_by_counts', 'total_counts', 'n_cells', 'mean', 'std'
    uns: '_scvi_manager_uuid', '_scvi_uuid', 'ambient_profile_Gene Expression', 'ambient_profile_all', 'leiden', 'leiden_colors', 'log1p', 'neighbors', 'pca', 'prediction_colors', 'sample_colors', 'type_colors', 'umap'
    obsm: 'X_pca', 'X_umap'
    varm: 'PCs'
    layers: 'ambient_counts', 'counts', 'log1p_norm', 'APR_counts'
    obsp: 'connectivities', 'distances'
fig, axes = plt.subplots(1, 2, figsize=(10, 5))
p1 = sns.histplot(adata_QC.obs["total_counts"], bins=100, kde=True, ax=axes[0])
axes[0].set_title("Total counts")
p2 = sns.histplot(
    adata_QC.layers["APR_counts"].sum(1), bins=100, kde=True, ax=axes[1]
)
axes[1].set_title("APR_counts")
plt.show()
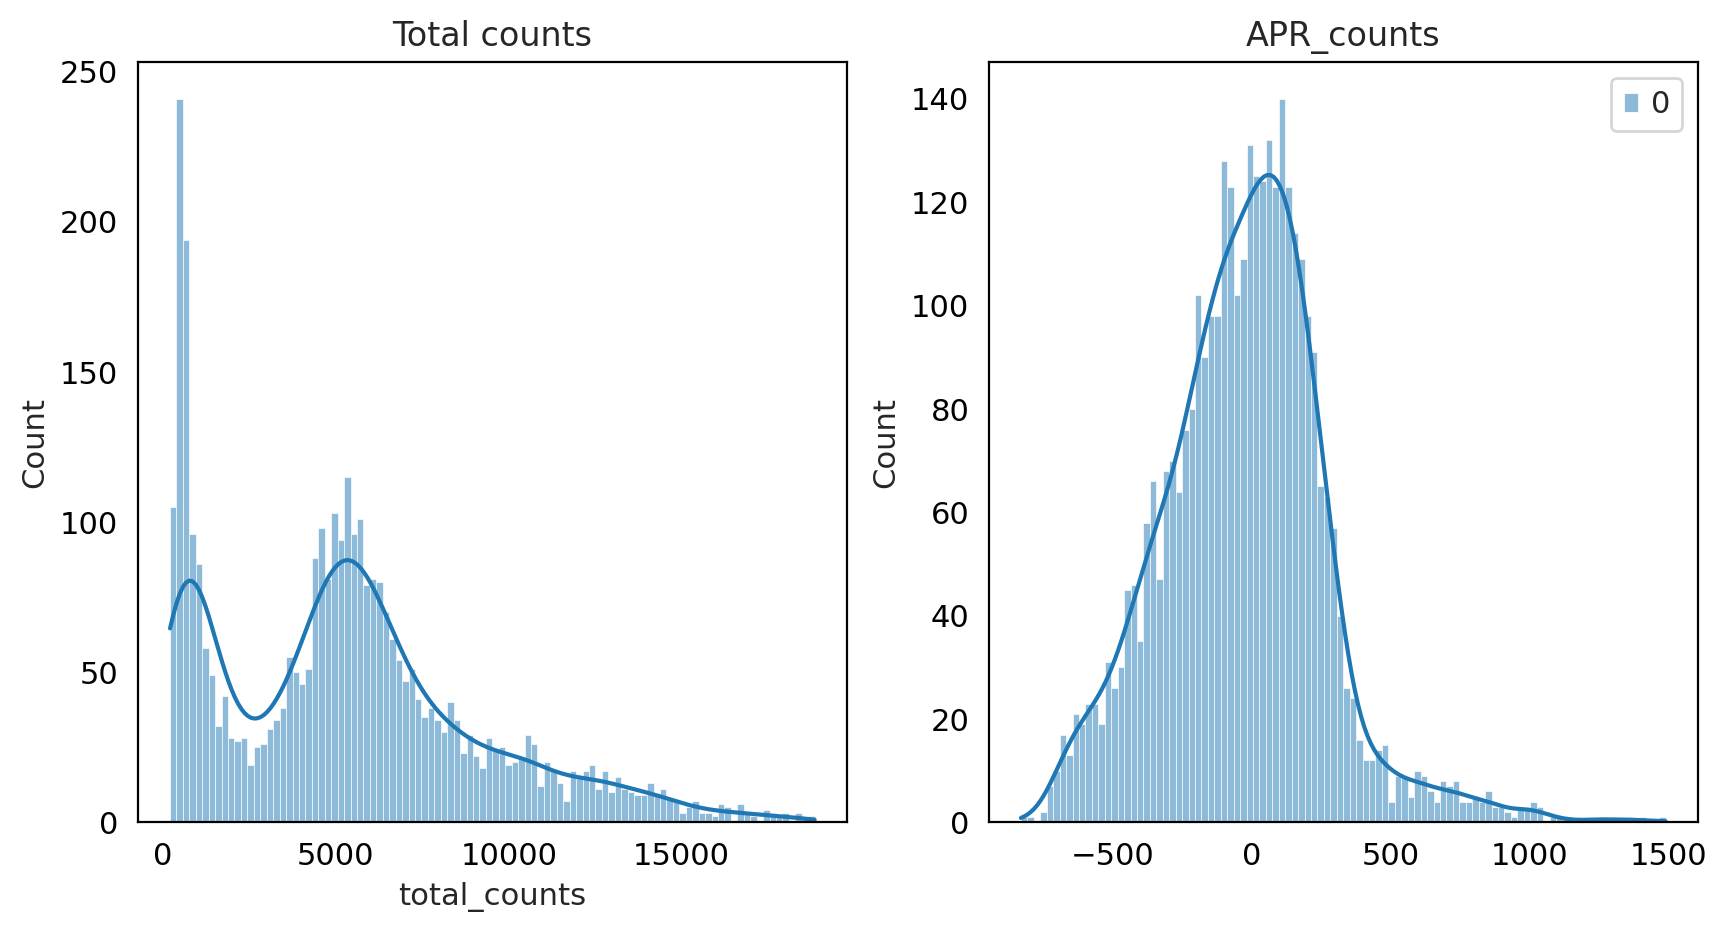
As you can see for this data Pearson Residual method performed well .
adata_QC
AnnData object with n_obs × n_vars = 3536 × 7650
    obs: 'type', 'sample', 'batch', 'n_genes_by_counts', 'total_counts', 'pct_counts_in_top_20_genes', 'total_counts_mt', 'pct_counts_mt', 'total_counts_ribo', 'pct_counts_ribo', 'total_counts_hb', 'pct_counts_hb', 'outlier', 'mt_outlier', 'n_counts', 'S_score', 'G2M_score', 'phase', '_scvi_batch', '_scvi_labels', 'prediction', 'leiden', 'doublet'
    var: 'gene_ids', 'feature_types', 'genome', 'mt', 'ribo', 'hb', 'n_cells_by_counts', 'mean_counts', 'pct_dropout_by_counts', 'total_counts', 'n_cells', 'mean', 'std'
    uns: '_scvi_manager_uuid', '_scvi_uuid', 'ambient_profile_Gene Expression', 'ambient_profile_all', 'leiden', 'leiden_colors', 'log1p', 'neighbors', 'pca', 'prediction_colors', 'sample_colors', 'type_colors', 'umap'
    obsm: 'X_pca', 'X_umap'
    varm: 'PCs'
    layers: 'ambient_counts', 'counts', 'log1p_norm', 'APR_counts'
    obsp: 'connectivities', 'distances'
Feature Selection#
#@title select features

%%R
library(scry)
# Don/t run this in %%R because it is python code

ro.globalenv["adata_QC"] = adata_QC
%%R
sce = devianceFeatureSelection(adata_QC, assay="X")
sce
class: SingleCellExperiment
dim: 7650 3536
metadata(13): _scvi_manager_uuid _scvi_uuid ... type_colors umap
assays(5): X ambient_counts counts log1p_norm APR_counts
rownames(7650): AL669831.5 FAM41C ... AL592183.1 AC004556.1
rowData names(14): gene_ids feature_types ... std binomial_deviance
colnames(3536): AGGGTCCCATGACCCG-1-0 ATTCCTAGTGACTGTT-1-0 ...
  GAGGCCTTCTCCTGCA-14-5 CCCTAACAGTTTCTTC-14-5
colData names(23): type sample ... leiden doublet
reducedDimNames(2): PCA UMAP
mainExpName: NULL
altExpNames(0):
binomial_deviance = ro.r("rowData(sce)$binomial_deviance").T
idx = binomial_deviance.argsort()[-4000:]
mask = np.zeros(adata_QC.var_names.shape, dtype=bool)
mask[idx] = True

adata_QC.var["highly_deviant"] = mask
adata_QC.var["binomial_deviance"] = binomial_deviance
adata_QC
AnnData object with n_obs × n_vars = 3536 × 7650
    obs: 'type', 'sample', 'batch', 'n_genes_by_counts', 'total_counts', 'pct_counts_in_top_20_genes', 'total_counts_mt', 'pct_counts_mt', 'total_counts_ribo', 'pct_counts_ribo', 'total_counts_hb', 'pct_counts_hb', 'outlier', 'mt_outlier', 'n_counts', 'S_score', 'G2M_score', 'phase', '_scvi_batch', '_scvi_labels', 'prediction', 'leiden', 'doublet'
    var: 'gene_ids', 'feature_types', 'genome', 'mt', 'ribo', 'hb', 'n_cells_by_counts', 'mean_counts', 'pct_dropout_by_counts', 'total_counts', 'n_cells', 'mean', 'std', 'highly_deviant', 'binomial_deviance'
    uns: '_scvi_manager_uuid', '_scvi_uuid', 'ambient_profile_Gene Expression', 'ambient_profile_all', 'leiden', 'leiden_colors', 'log1p', 'neighbors', 'pca', 'prediction_colors', 'sample_colors', 'type_colors', 'umap'
    obsm: 'X_pca', 'X_umap'
    varm: 'PCs'
    layers: 'ambient_counts', 'counts', 'log1p_norm', 'APR_counts'
    obsp: 'connectivities', 'distances'
Save QC fitered Normalized Feature selected object#
save_file = 'Objects/sc_QCNFS_covid.h5ad'
adata_QC.write_h5ad(save_file)
PCA,tSNE,UMAP#
#@title Load QC Filtered Normalized Feature selected object

adata_QCNFS = sc.read_h5ad(filename= "/content/drive/MyDrive/scRNA_using_Python/Objects/sc_QCNFS_covid.h5ad")

adata_QCNFS
AnnData object with n_obs × n_vars = 3536 × 7650
    obs: 'type', 'sample', 'batch', 'n_genes_by_counts', 'total_counts', 'pct_counts_in_top_20_genes', 'total_counts_mt', 'pct_counts_mt', 'total_counts_ribo', 'pct_counts_ribo', 'total_counts_hb', 'pct_counts_hb', 'outlier', 'mt_outlier', 'n_counts', 'S_score', 'G2M_score', 'phase', '_scvi_batch', '_scvi_labels', 'prediction', 'leiden', 'doublet'
    var: 'gene_ids', 'feature_types', 'genome', 'mt', 'ribo', 'hb', 'n_cells_by_counts', 'mean_counts', 'pct_dropout_by_counts', 'total_counts', 'n_cells', 'mean', 'std', 'highly_deviant', 'binomial_deviance'
    uns: '_scvi_manager_uuid', '_scvi_uuid', 'ambient_profile_Gene Expression', 'ambient_profile_all', 'leiden', 'leiden_colors', 'log1p', 'neighbors', 'pca', 'prediction_colors', 'sample_colors', 'type_colors', 'umap'
    obsm: 'X_pca', 'X_umap'
    varm: 'PCs'
    layers: 'APR_counts', 'ambient_counts', 'counts', 'log1p_norm'
    obsp: 'connectivities', 'distances'
PCA
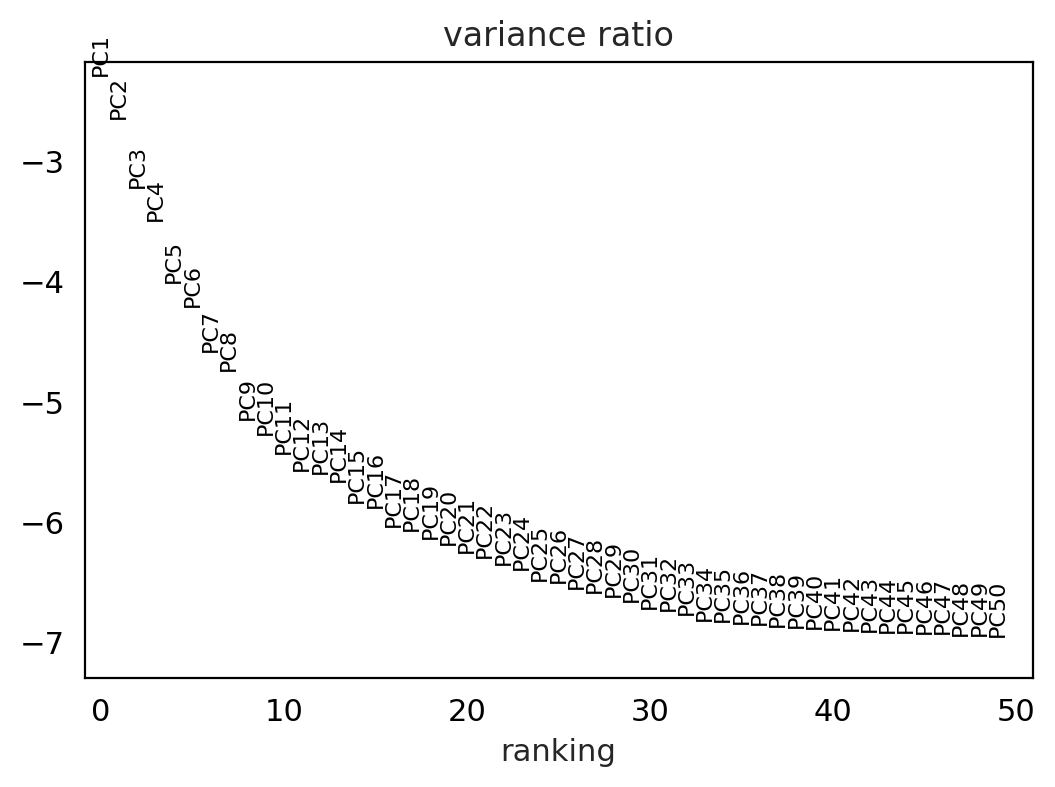
PCA offers the advantage that it is highly interpretable and computationally efficient. However, as scRNA-seq datasets are rather sparse due to dropout events and therefore highly non-linear, visualization with the linear dimensionality reduction technique PCA is not very appropriate. PCA is typically used to select the top 10-50 PCs which are used for downstream analysis tasks.
t-SNE UMAP
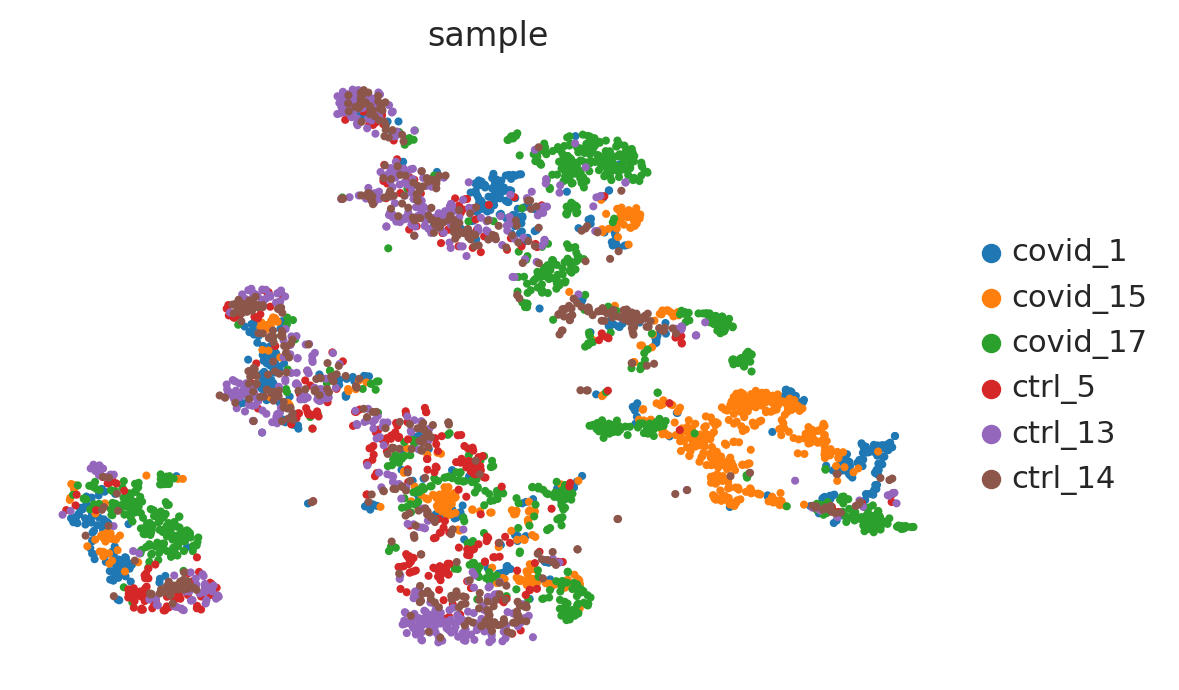
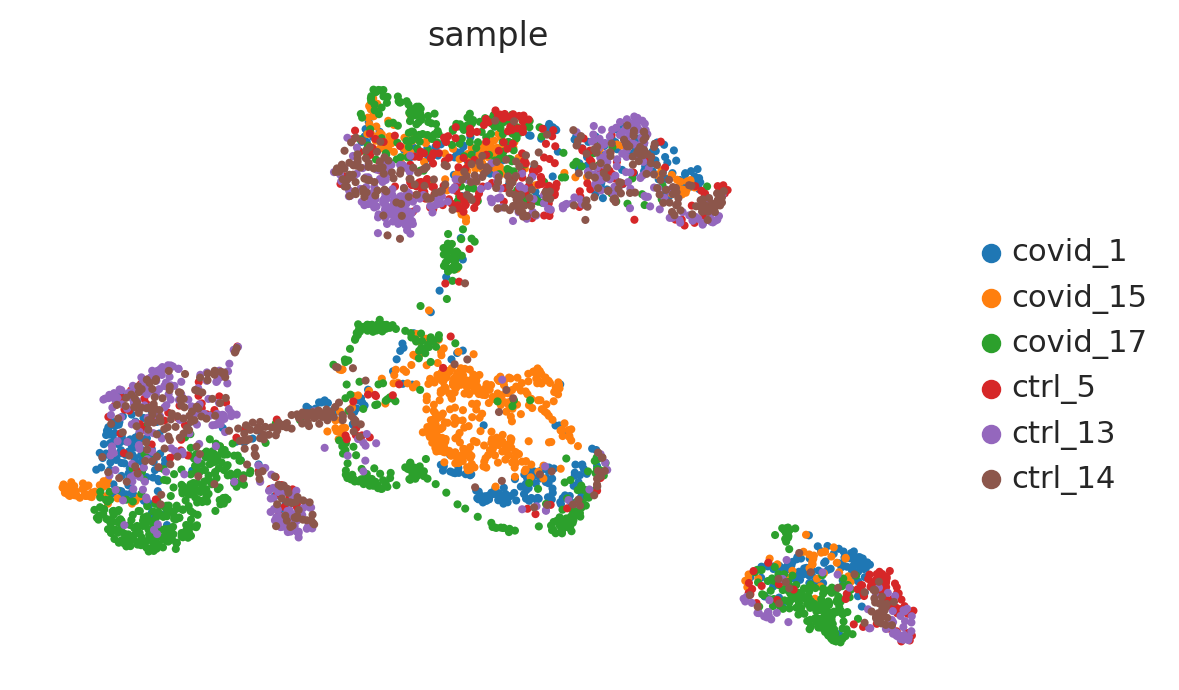
t-distributed stochastic neighbor embedding (t-SNE) as it yielded the best overall performance. Uniform manifold approximation and projection (UMAP) showed the highest stability and separates best the original cell populations.
adata_for_PCA = adata_QCNFS.copy()

adata_for_PCA
AnnData object with n_obs × n_vars = 3536 × 7650
    obs: 'type', 'sample', 'batch', 'n_genes_by_counts', 'total_counts', 'pct_counts_in_top_20_genes', 'total_counts_mt', 'pct_counts_mt', 'total_counts_ribo', 'pct_counts_ribo', 'total_counts_hb', 'pct_counts_hb', 'outlier', 'mt_outlier', 'n_counts', 'S_score', 'G2M_score', 'phase', '_scvi_batch', '_scvi_labels', 'prediction', 'leiden', 'doublet'
    var: 'gene_ids', 'feature_types', 'genome', 'mt', 'ribo', 'hb', 'n_cells_by_counts', 'mean_counts', 'pct_dropout_by_counts', 'total_counts', 'n_cells', 'mean', 'std', 'highly_deviant', 'binomial_deviance'
    uns: '_scvi_manager_uuid', '_scvi_uuid', 'ambient_profile_Gene Expression', 'ambient_profile_all', 'leiden', 'leiden_colors', 'log1p', 'neighbors', 'pca', 'prediction_colors', 'sample_colors', 'type_colors', 'umap'
    obsm: 'X_pca', 'X_umap'
    varm: 'PCs'
    layers: 'APR_counts', 'ambient_counts', 'counts', 'log1p_norm'
    obsp: 'connectivities', 'distances'
# Perform Z scale Normalization to use for PCA
# use the count matrix layer zscale_norm_counts

# USe highly deviance genes as highly variable for PCA
# regress out unwanted variables
sc.pp.regress_out(adata_for_PCA, ['total_counts', 'pct_counts_mt'])


# scale data, clip values exceeding standard deviation 10.
sc.pp.scale(adata_for_PCA, max_value=10)

adata_for_PCA
AnnData object with n_obs × n_vars = 3536 × 7650
    obs: 'type', 'sample', 'batch', 'n_genes_by_counts', 'total_counts', 'pct_counts_in_top_20_genes', 'total_counts_mt', 'pct_counts_mt', 'total_counts_ribo', 'pct_counts_ribo', 'total_counts_hb', 'pct_counts_hb', 'outlier', 'mt_outlier', 'n_counts', 'S_score', 'G2M_score', 'phase', '_scvi_batch', '_scvi_labels', 'prediction', 'leiden', 'doublet'
    var: 'gene_ids', 'feature_types', 'genome', 'mt', 'ribo', 'hb', 'n_cells_by_counts', 'mean_counts', 'pct_dropout_by_counts', 'total_counts', 'n_cells', 'mean', 'std', 'highly_deviant', 'binomial_deviance'
    uns: '_scvi_manager_uuid', '_scvi_uuid', 'ambient_profile_Gene Expression', 'ambient_profile_all', 'leiden', 'leiden_colors', 'log1p', 'neighbors', 'pca', 'prediction_colors', 'sample_colors', 'type_colors', 'umap'
    obsm: 'X_pca', 'X_umap'
    varm: 'PCs'
    layers: 'APR_counts', 'ambient_counts', 'counts', 'log1p_norm'
    obsp: 'connectivities', 'distances'
#@title we use log nomalize data

adata_for_PCA.X = adata_for_PCA.layers["log1p_norm"]

adata_for_PCA
AnnData object with n_obs × n_vars = 3536 × 7650
    obs: 'type', 'sample', 'batch', 'n_genes_by_counts', 'total_counts', 'pct_counts_in_top_20_genes', 'total_counts_mt', 'pct_counts_mt', 'total_counts_ribo', 'pct_counts_ribo', 'total_counts_hb', 'pct_counts_hb', 'outlier', 'mt_outlier', 'n_counts', 'S_score', 'G2M_score', 'phase', '_scvi_batch', '_scvi_labels', 'prediction', 'leiden', 'doublet'
    var: 'gene_ids', 'feature_types', 'genome', 'mt', 'ribo', 'hb', 'n_cells_by_counts', 'mean_counts', 'pct_dropout_by_counts', 'total_counts', 'n_cells', 'mean', 'std', 'highly_deviant', 'binomial_deviance'
    uns: '_scvi_manager_uuid', '_scvi_uuid', 'ambient_profile_Gene Expression', 'ambient_profile_all', 'leiden', 'leiden_colors', 'log1p', 'neighbors', 'pca', 'prediction_colors', 'sample_colors', 'type_colors', 'umap'
    obsm: 'X_pca', 'X_umap'
    varm: 'PCs'
    layers: 'APR_counts', 'ambient_counts', 'counts', 'log1p_norm'
    obsp: 'connectivities', 'distances'
#@title set highl variable as highly deviance

# setting highly variable as highly deviant to use scanpy 'use_highly_variable' argument in sc.pp.pca
adata_for_PCA.var["highly_variable"] = adata_for_PCA.var["highly_deviant"]
#@title Perform PCA


sc.pp.pca(adata_for_PCA, svd_solver="arpack", use_highly_variable=True)
adata_for_PCA
AnnData object with n_obs × n_vars = 3536 × 7650
    obs: 'type', 'sample', 'batch', 'n_genes_by_counts', 'total_counts', 'pct_counts_in_top_20_genes', 'total_counts_mt', 'pct_counts_mt', 'total_counts_ribo', 'pct_counts_ribo', 'total_counts_hb', 'pct_counts_hb', 'outlier', 'mt_outlier', 'n_counts', 'S_score', 'G2M_score', 'phase', '_scvi_batch', '_scvi_labels', 'prediction', 'leiden', 'doublet'
    var: 'gene_ids', 'feature_types', 'genome', 'mt', 'ribo', 'hb', 'n_cells_by_counts', 'mean_counts', 'pct_dropout_by_counts', 'total_counts', 'n_cells', 'mean', 'std', 'highly_deviant', 'binomial_deviance', 'highly_variable'
    uns: '_scvi_manager_uuid', '_scvi_uuid', 'ambient_profile_Gene Expression', 'ambient_profile_all', 'leiden', 'leiden_colors', 'log1p', 'neighbors', 'pca', 'prediction_colors', 'sample_colors', 'type_colors', 'umap'
    obsm: 'X_pca', 'X_umap'
    varm: 'PCs'
    layers: 'APR_counts', 'ambient_counts', 'counts', 'log1p_norm'
    obsp: 'connectivities', 'distances'
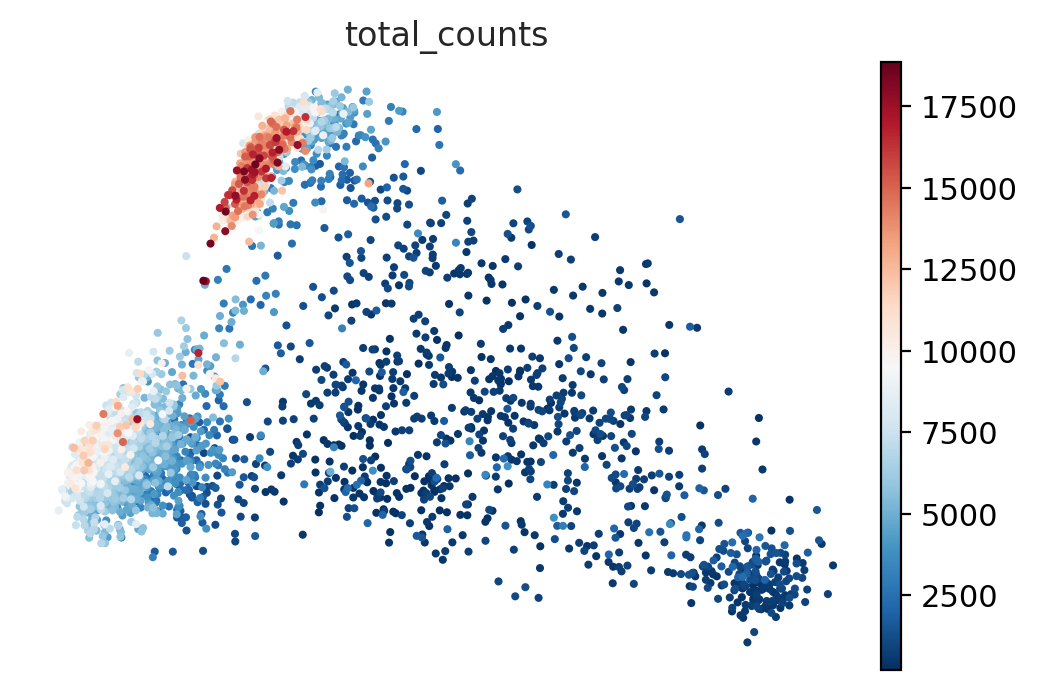
#@title Plot PCA

sc.pl.pca_scatter(adata_for_PCA, color="total_counts")
sc.pl.pca(adata_for_PCA, color='sample', components = ['1,2','3,4','5,6','7,8'], ncols=4)

To identify genes that contribute most to each PC, one can retreive the loading matrix information.
#Plot loadings
sc.pl.pca_loadings(adata_for_PCA, components=[1,2,3,4,5,6,7,8])

# OBS! only plots the positive axes genes from each PC!!
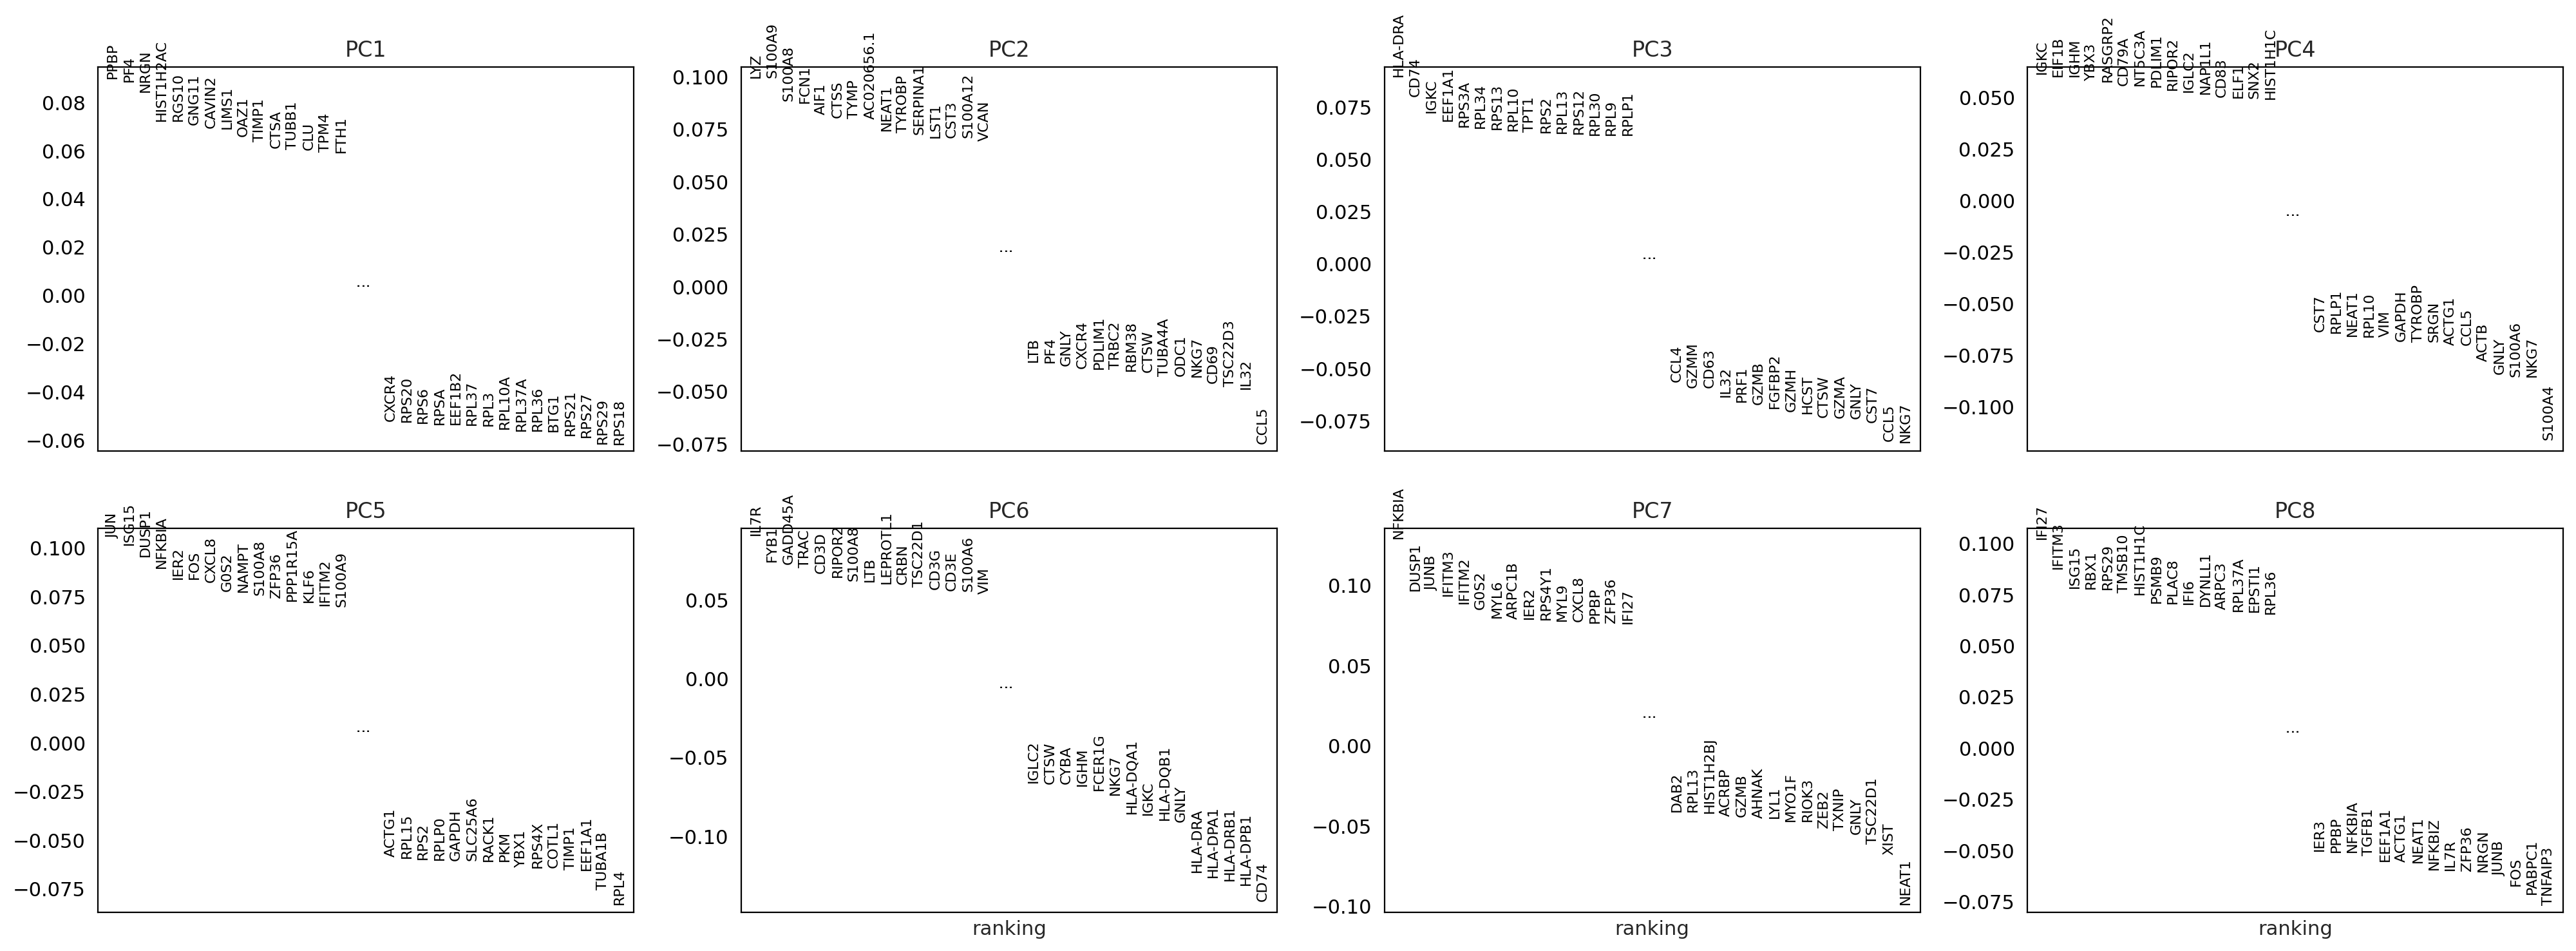
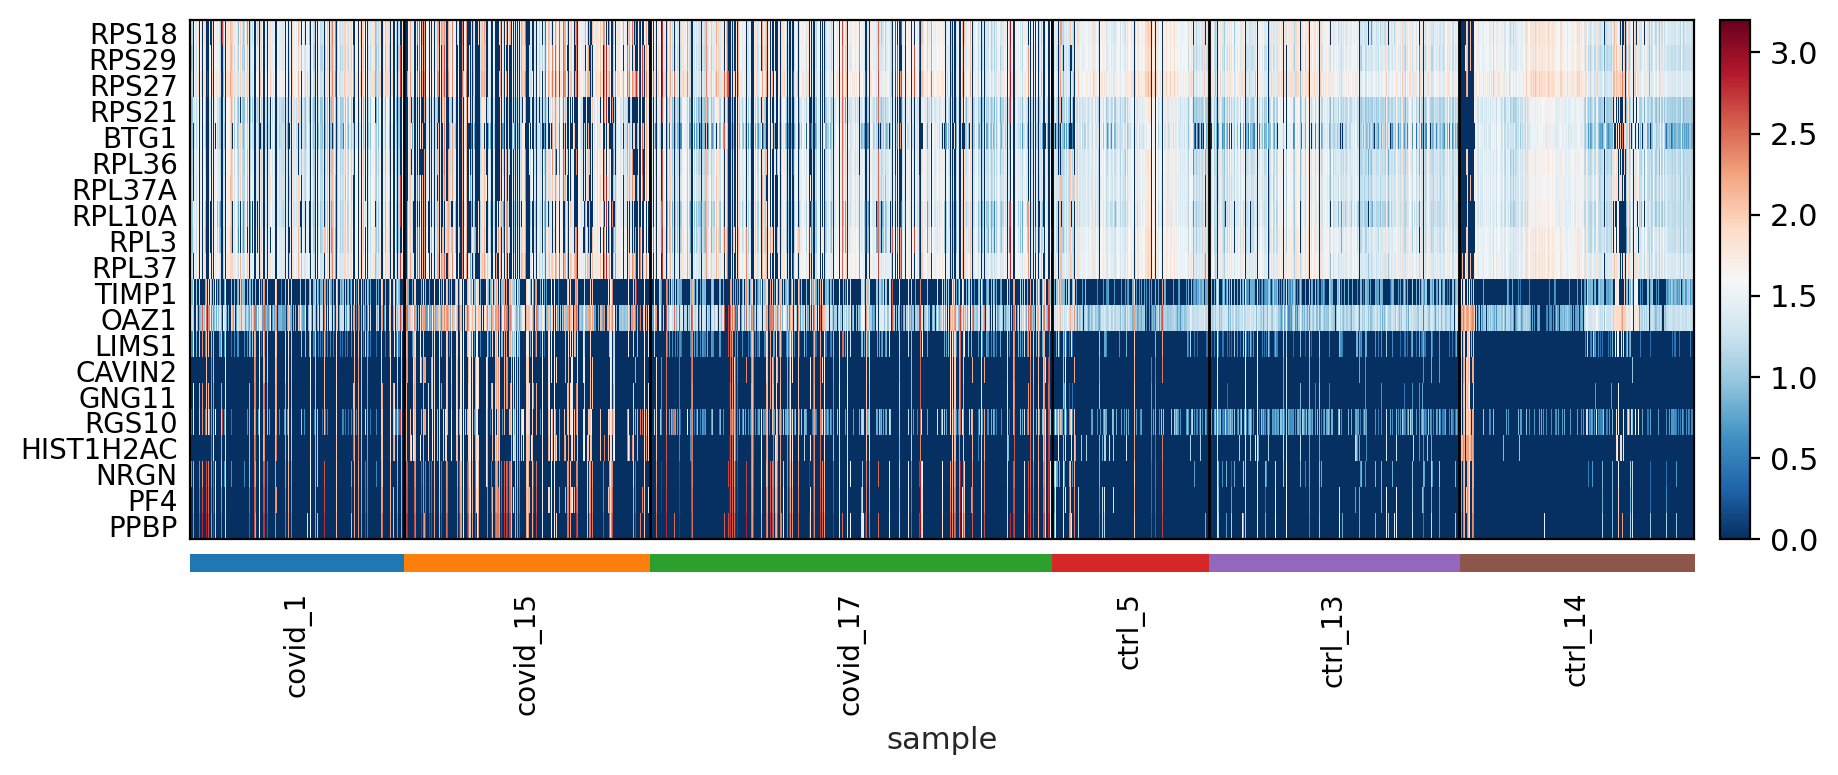
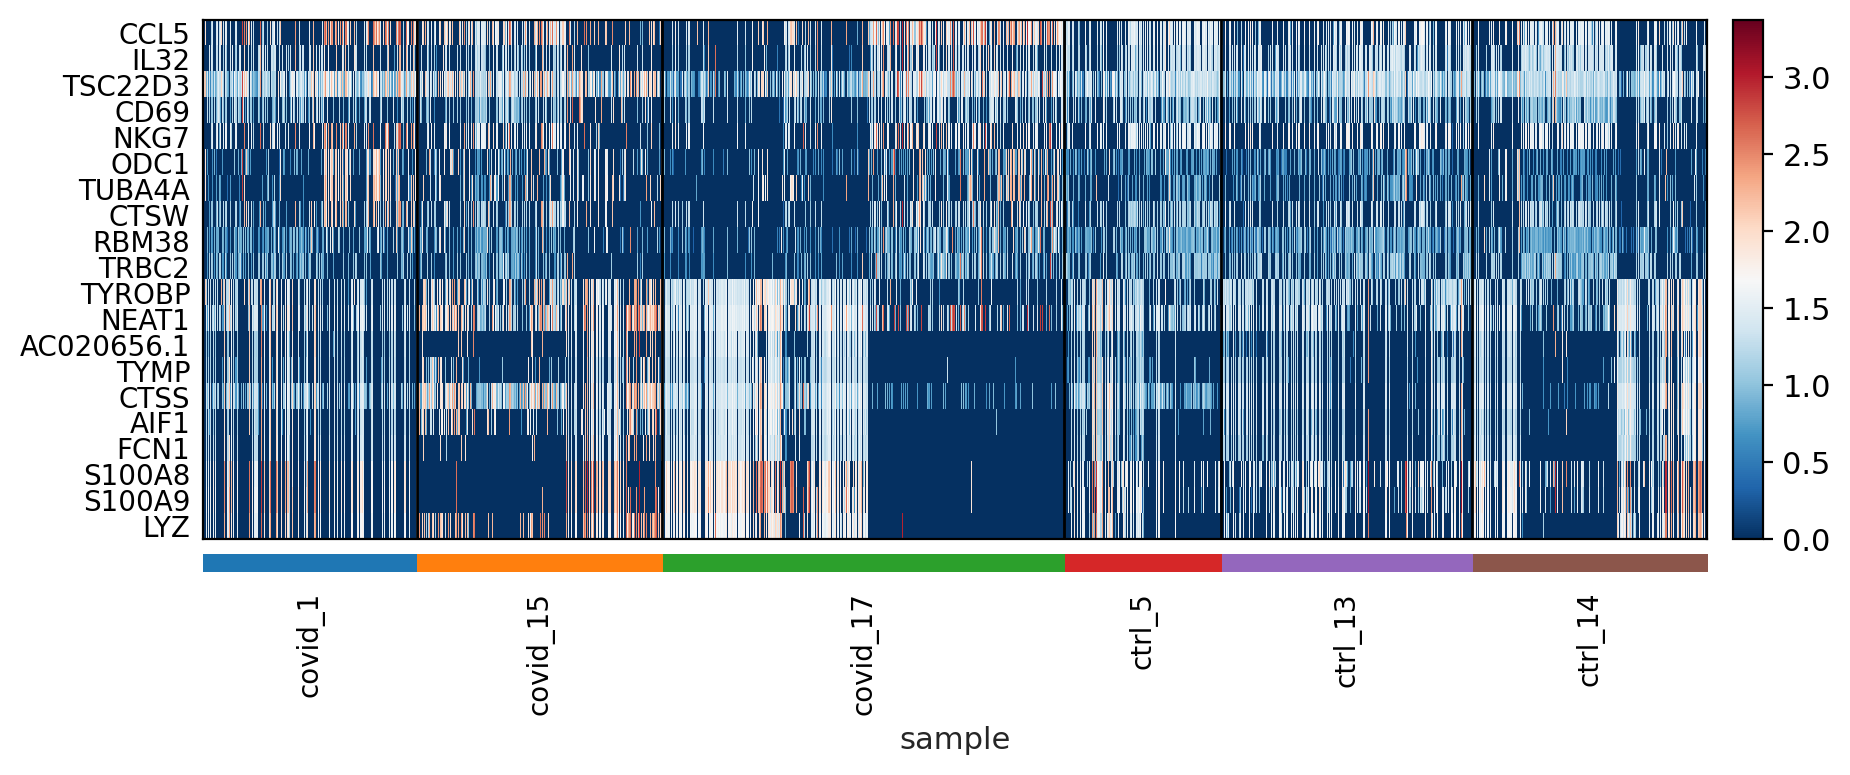
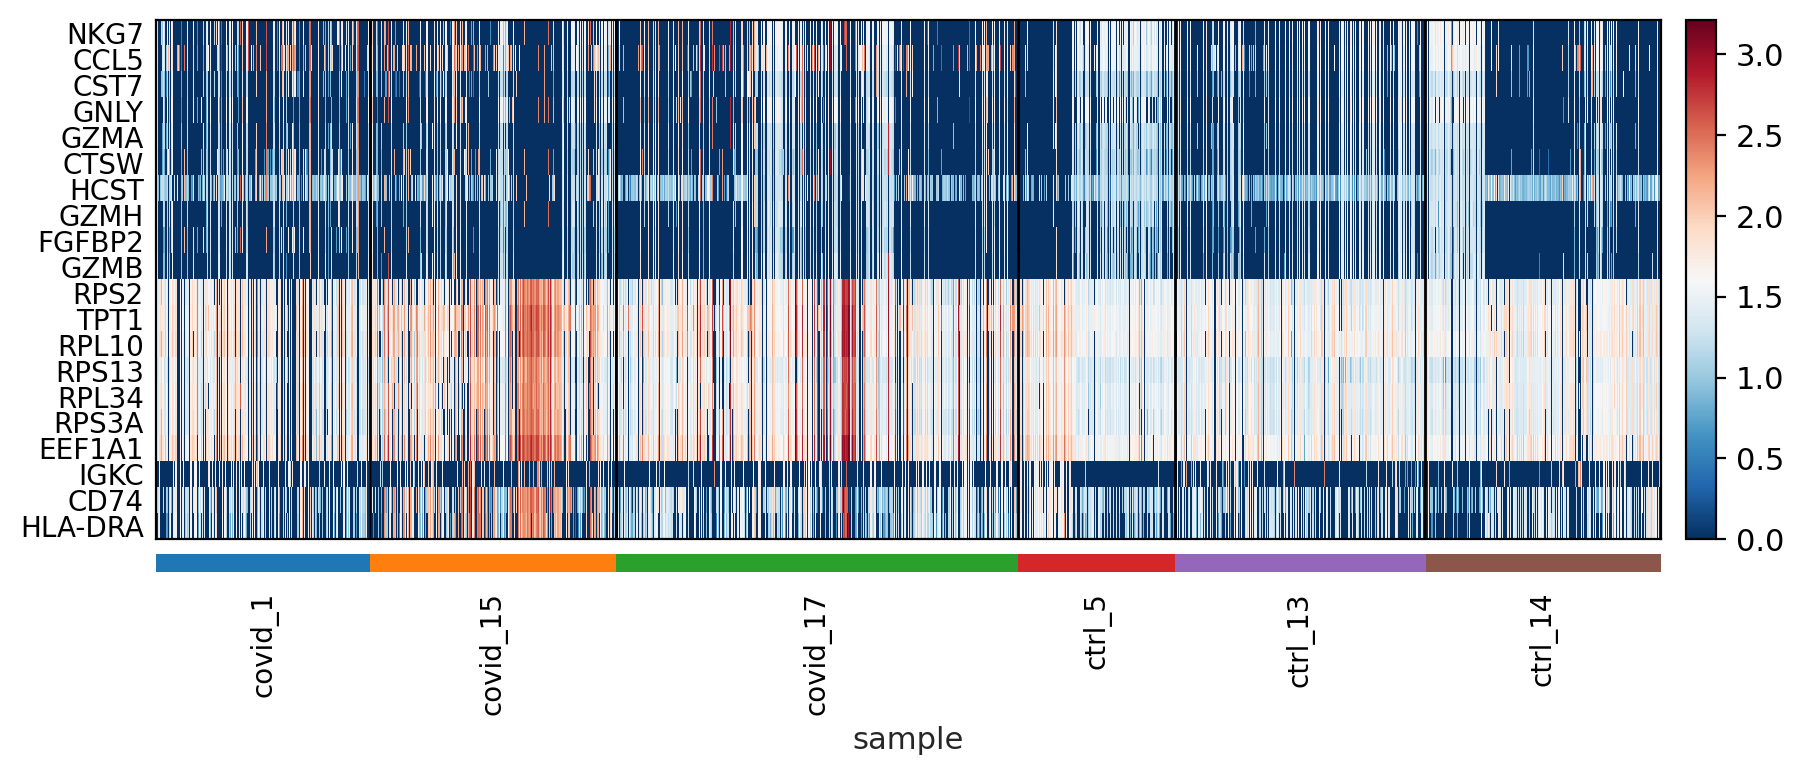
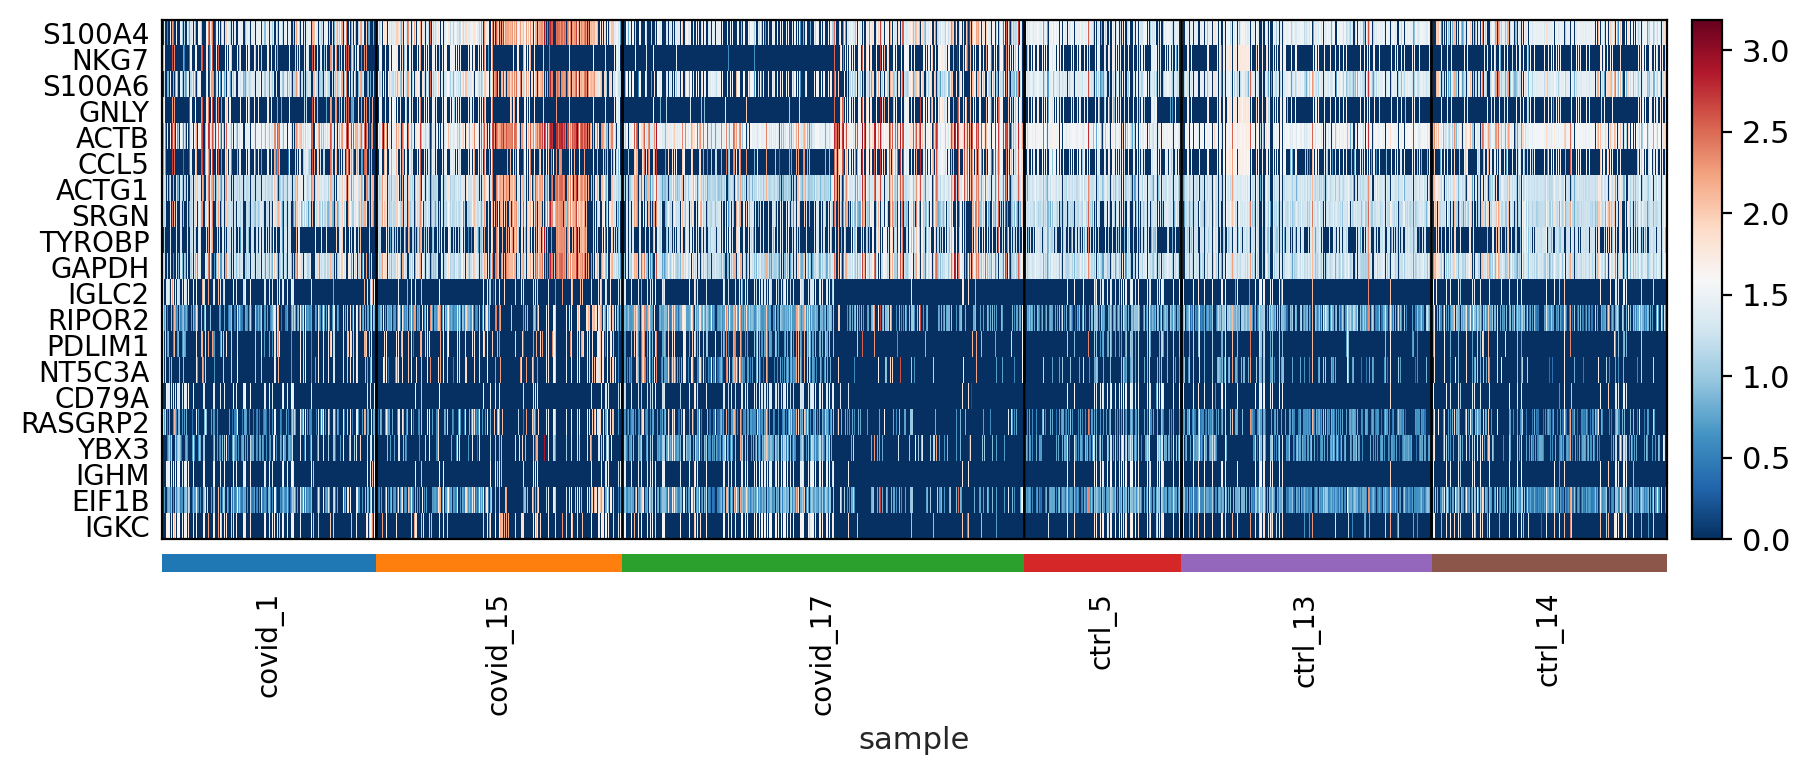
The function to plot loading genes only plots genes on the positive axes. Instead plot as a heatmaps, with genes on both postive and negative side, one per pc, and plot their expression amongst cells ordered by their position along the pc.
adata_for_PCA.obs.head(4)
| type | sample | batch | n_genes_by_counts | total_counts | pct_counts_in_top_20_genes | total_counts_mt | pct_counts_mt | total_counts_ribo | pct_counts_ribo | ... | mt_outlier | n_counts | S_score | G2M_score | phase | _scvi_batch | _scvi_labels | prediction | leiden | doublet | |
|---|---|---|---|---|---|---|---|---|---|---|---|---|---|---|---|---|---|---|---|---|---|
| AGGGTCCCATGACCCG-1-0 | Covid | covid_1 | 0 | 2140 | 7698.0 | 24.123149 | 525.0 | 6.819953 | 2564.0 | 33.307353 | ... | False | 5929.0 | 0.115495 | -0.181939 | S | 0 | 0 | singlet | 2 | singlet |
| ATTCCTAGTGACTGTT-1-0 | Covid | covid_1 | 0 | 1808 | 7535.0 | 27.458527 | 470.0 | 6.237558 | 3397.0 | 45.082946 | ... | False | 5855.0 | 0.299016 | 0.346879 | G2M | 0 | 0 | singlet | 5 | singlet |
| CCTAAGACAGATTAAG-1-0 | Covid | covid_1 | 0 | 2449 | 9025.0 | 19.789474 | 513.0 | 5.684211 | 2637.0 | 29.218837 | ... | False | 7611.0 | 0.407661 | 0.150615 | S | 0 | 0 | singlet | 5 | singlet |
| AATAGAGAGGGTTAGC-1-0 | Covid | covid_1 | 0 | 392 | 937.0 | 38.313767 | 63.0 | 6.723586 | 63.0 | 6.723586 | ... | False | 773.0 | 0.071607 | -0.092472 | S | 0 | 0 | singlet | 8 | singlet |
4 rows × 23 columns
# adata.obsm["X_pca"] is the embeddings
# adata.uns["pca"] is pc variance
# adata.varm['PCs'] is the loadings

genes = adata_for_PCA.var['gene_ids']

for pc in [1,2,3,4]:
    g = adata_for_PCA.varm['PCs'][:,pc-1]
    o = np.argsort(g)
    sel = np.concatenate((o[:10],o[-10:])).tolist()
    emb = adata_for_PCA.obsm['X_pca'][:,pc-1]
    # order by position on that pc
    tempdata = adata_for_PCA[np.argsort(emb),]
    sc.pl.heatmap(tempdata, var_names = genes[sel].index.tolist(), groupby='sample', swap_axes = True, use_raw=False)
sc.pl.pca_variance_ratio(adata_for_PCA, log=True, n_pcs = 50)
#@title t-SNE

sc.tl.tsne(adata_for_PCA, use_rep="X_pca")

sc.pl.tsne(adata_for_PCA, color="sample")
#@title U-MAP

sc.pp.neighbors(adata_for_PCA)
sc.tl.umap(adata_for_PCA)

sc.pl.umap(adata_for_PCA, color="sample")
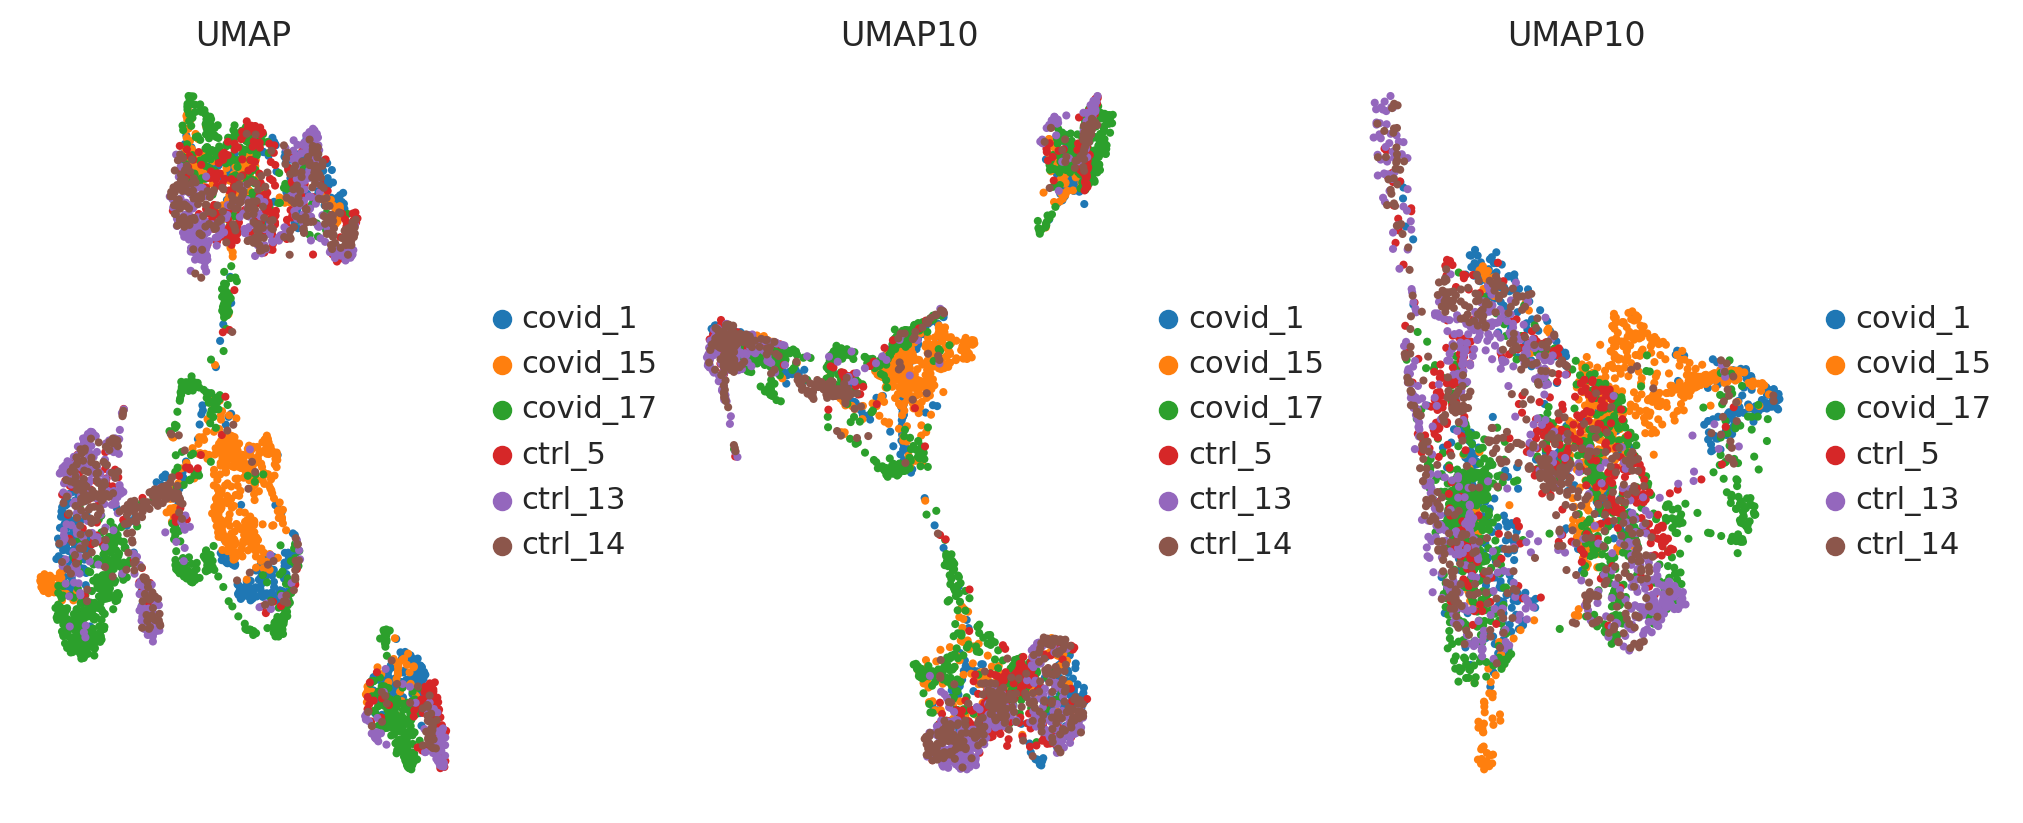
#run with 10 components, save to a new object so that the umap with 2D is not overwritten.
umap10 = sc.tl.umap(adata_for_PCA, n_components=10, copy=True)
fig, axs = plt.subplots(1, 3, figsize=(10,4),constrained_layout=True)

sc.pl.umap(adata_for_PCA, color='sample',  title="UMAP", show=False, ax=axs[0])
sc.pl.umap(umap10, color='sample', title="UMAP10", show=False, ax=axs[1], components=['1,2'])
sc.pl.umap(umap10, color='sample', title="UMAP10", show=False, ax=axs[2], components=['3,4'])
<Axes: title={'center': 'UMAP10'}, xlabel='UMAP3', ylabel='UMAP4'>
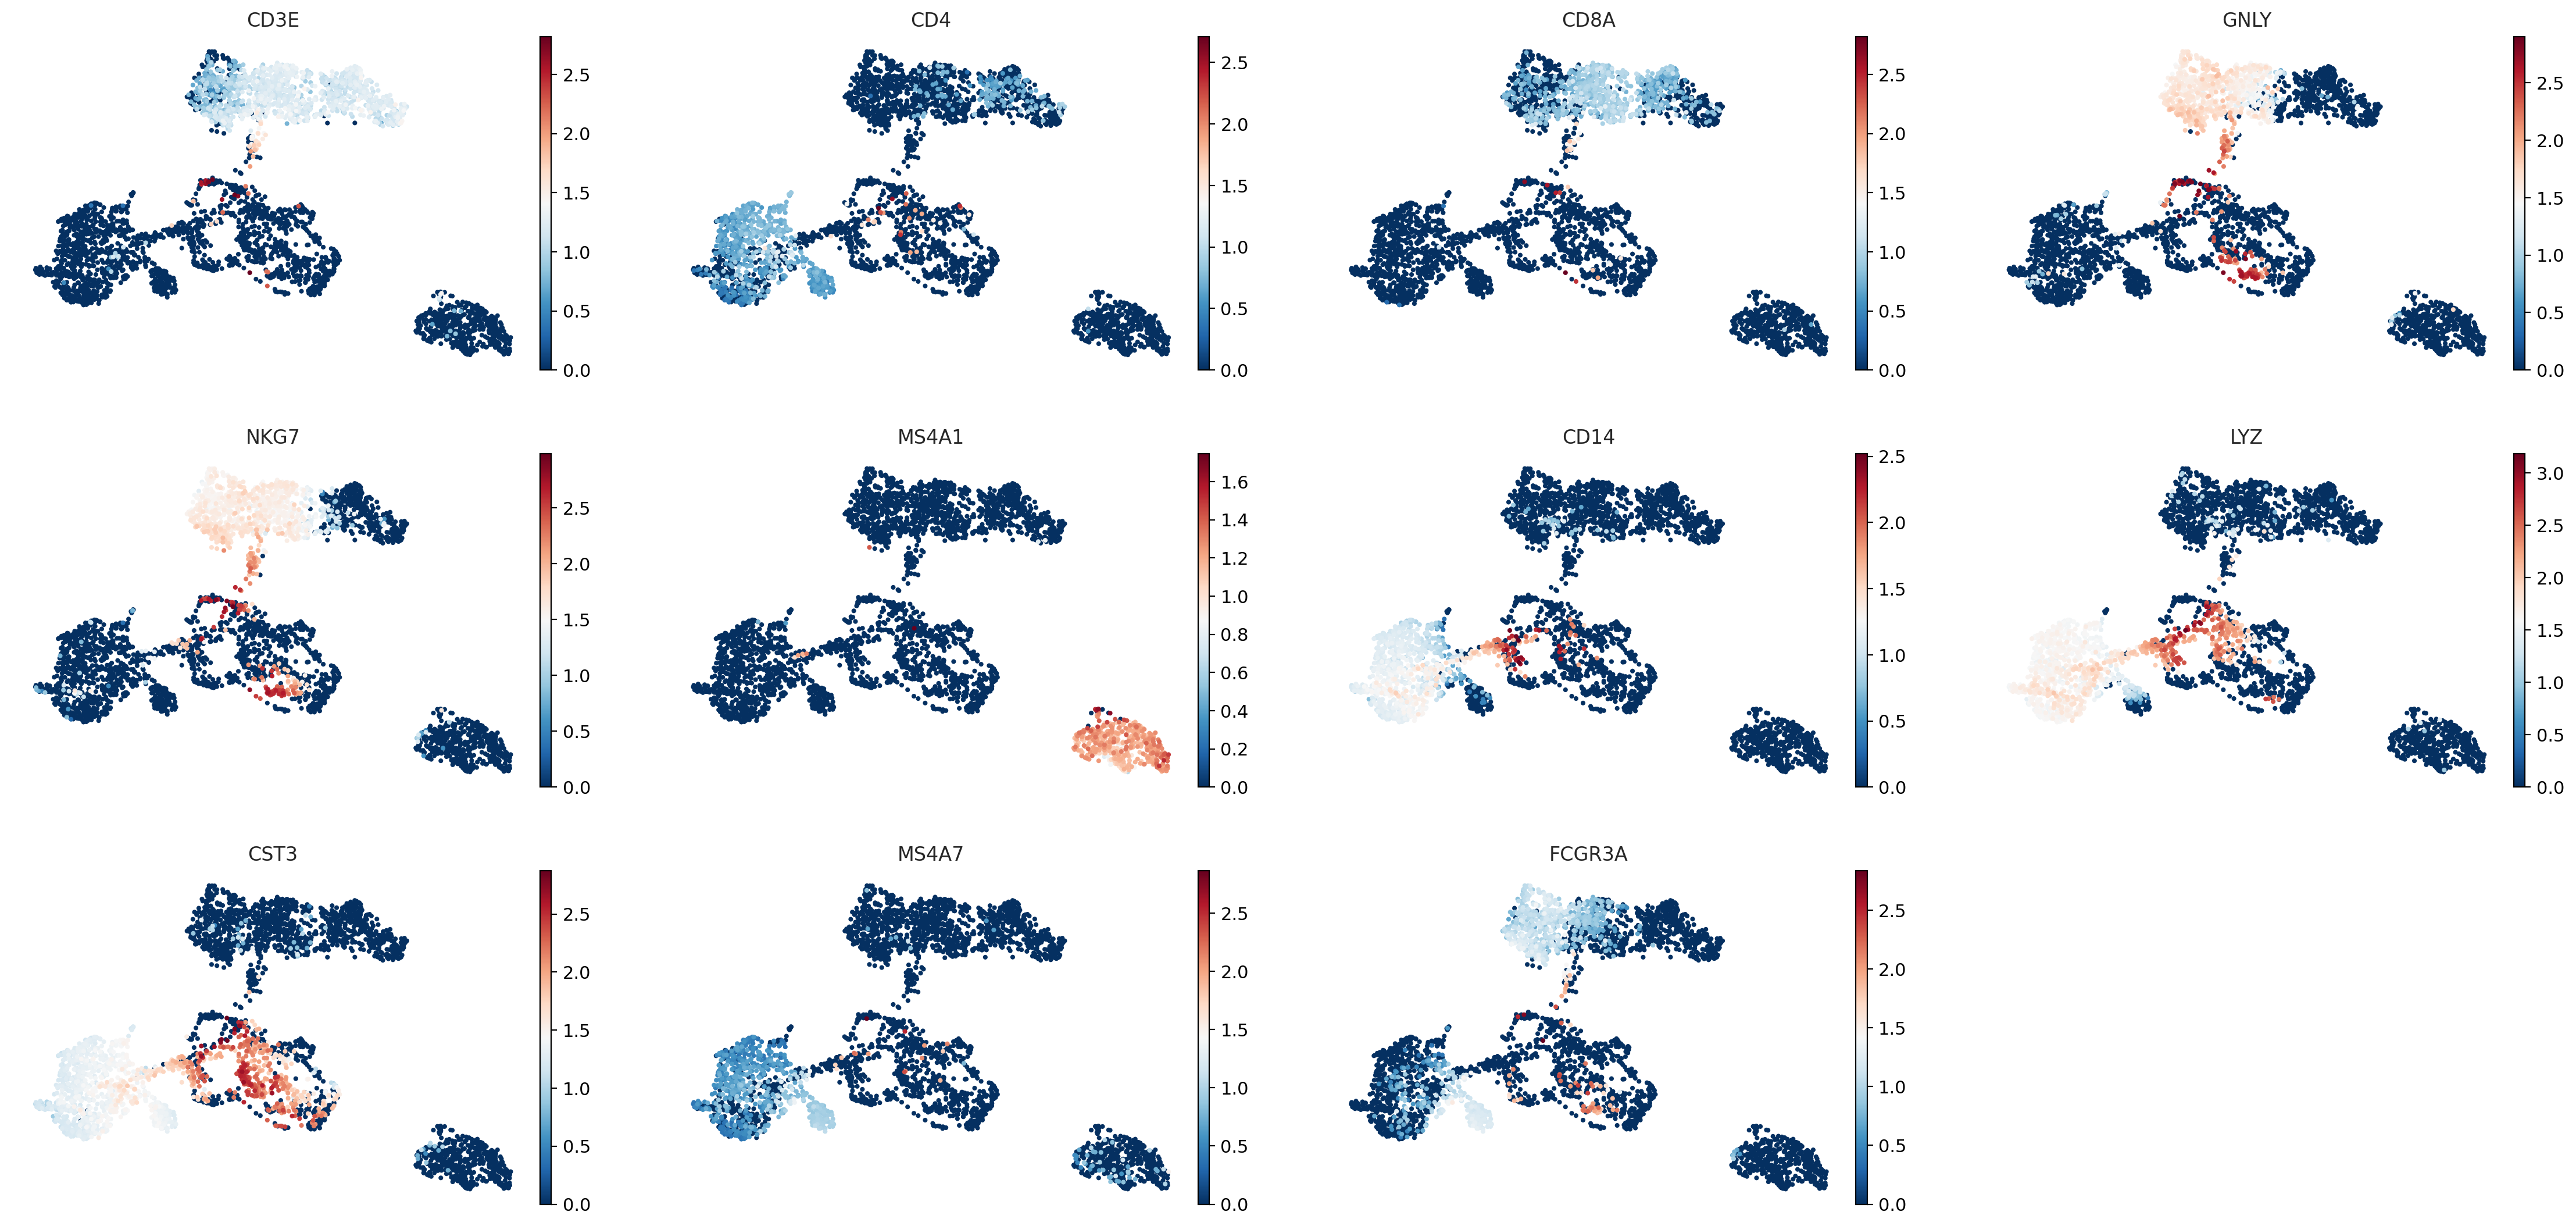
sc.pl.umap(adata_for_PCA, color=["CD3E", "CD4", "CD8A", "GNLY","NKG7", "MS4A1","CD14","LYZ","CST3","MS4A7","FCGR3A"])
sc.pl.umap(
    adata_for_PCA,
    color=["total_counts", "pct_counts_mt", 'pct_counts_ribo', 'pct_counts_hb', "doublet"],
)

Save QC filtered feature selected , DM reduced data object#
save_file = 'Objects/sc_QCNFSDM_covid.h5ad'
adata_for_PCA.write_h5ad(save_file)
